Population

| Total Population | Sex Ratio (Males per 100 Females) | % under 18 | % 65 or Older | % Minority | Median Household Income | Poverty Rate |
|---|---|---|---|---|---|---|---|
| Auburn | 5,390 | 100 | 20% | 14% | 3% | $115,100 | 2% |
| Bedford | 22,390 | 94 | 25% | 17% | 8% | $132,000 | 2% |
| Candia | 3,930 | 106 | 19% | 16% | 7% | $102,000 | 4% |
| Chester | 5,040 | 104 | 22% | 12% | 6% | $134,500 | 3% |
| Deerfield | 4,460 | 99 | 20% | 15% | 3% | $100,500 | 6% |
| Derry | 33,510 | 101 | 22% | 12% | 7% | $71,700 | 8% |
| Francestown | 1,650 | 102 | 19% | 19% | 5% | $101,700 | 3% |
| Goffstown | 18,060 | 91 | 20% | 16% | 5% | $85,500 | 6% |
| Hooksett | 14,220 | 92 | 19% | 17% | 7% | $83,900 | 5% |
| Londonderry | 25,530 | 95 | 23% | 13% | 7% | $101,500 | 3% |
| Manchester | 111,660 | 104 | 20% | 13% | 23% | $58,200 | 15% |
| New Boston | 5,620 | 96 | 26% | 10% | 3% | $108,900 | 2% |
| Weare | 9,010 | 92 | 24% | 9% | 4% | $86,900 | 6% |
| Windham | 14,510 | 102 | 26% | 14% | 8% | $133,200 | 1% |
| Total Population | Sex Ratio (Males per 100 Females) | % under 18 | % 65 or Older | % Minority | Median Household Income | Poverty Rate | |
|---|---|---|---|---|---|---|---|
| Hillsborough County | 411,090 | 99 | 21% | 15% | 15% | $78,700 | 8% |
Merrimack County | 149,450 | 97 | 20% | 17% | 7% | $72,500 | 7% |
Rockingham County | 305,130 | 98 | 20% | 17% | 7% | $90,400 | 5% |
| Total Population | Sex Ratio (Males per 100 Females) | % under 18 | % 65 or Older | % Minority | Median Household Income | Poverty Rate | |
|---|---|---|---|---|---|---|---|
| New Hampshire | 1,343,620 | 98 | 20% | 17% | 10% | $74,000 | 8% |
| New England | 14,769,720 | 95 | 20% | 17% | 25% | $72,000 | 11% |
| Northeast Region | 56,061,200 | 95 | 21% | 16% | 34% | $67,400 | 13% |
United States | 322,903,030 | 97 | 23% | 15% | 39% | $60,300 | 14% |
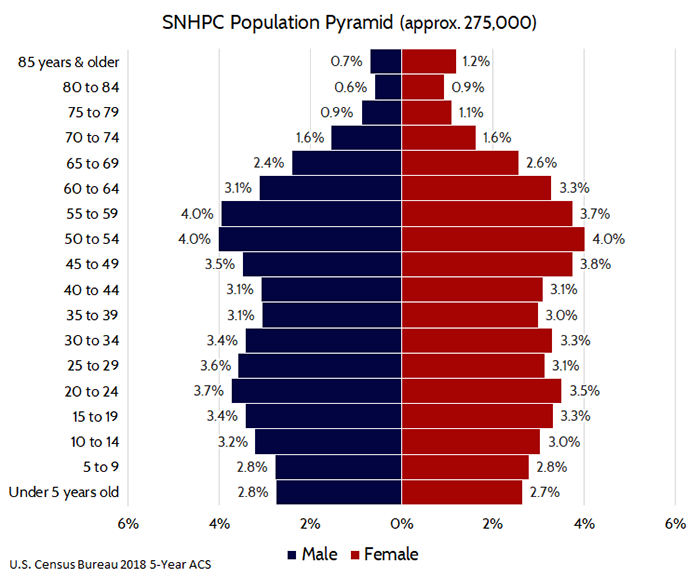
All figures are derived from the U.S. Census Bureau's 2018 5-Year American Community Survey. Absolute numbers have been rounded to the nearest ten, percentages and ratios to the nearest integer, and dollar values to the nearest $100.

